
Chapter 1: The Data Science Ecosystem#
import numpy
print("Hello")
Hello
from IPython.display import Image
Image('img/network_points.jpeg' , width=500)

The hype around Data Science#
The term Data Science has nothing fancy. The terms that compose it has been used among folks for decades. Data which is a piece of information of any kind, used for a specific purpose and Science, which is the art of using reasoning and logic to achieve a designed goal. But what does make this term such a hype?
Actually, The answer lies in the words “data” and “science” themselves.
Data:
Because gone are the days where data was a scarce currency: nowadays we are flooded with billions of data of any kind and sort.
Science:
Because powerful and easy-to-use scientific tools has been developed to deal with those data. Properly defined, Data science is a multidisciplinary field that combines the latest innovations in advanced analytics, including machine learning and artificial intelligence, with high-performance computing and visualizations.
Image('img/unreadable_programs.jpg' , width=500)
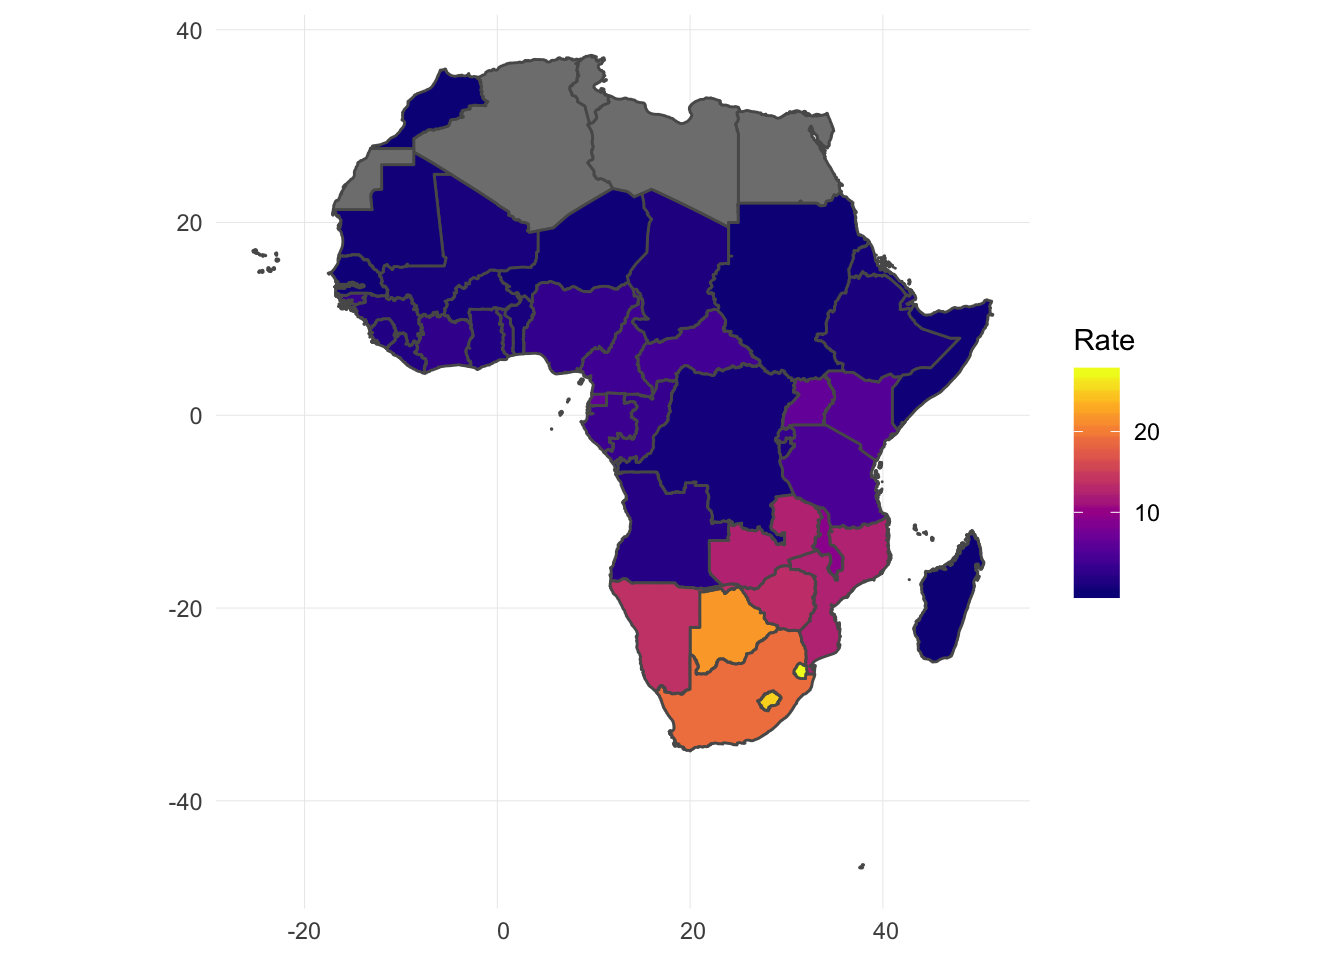
Where is Africa on the map of Data Science?#
The lack of skilled people in the data science industry and software engineering sectors is a problem worldwide but it is especially true on the African continent.
With the raise of accurate tools as well as the fastest growing amount of data on the continent in sectors like Agriculture, Health, Transportation, just to name a few, this issue can be resolved if the necessary training is provided.
Image('img/africa_continent.png' , width=500)
Data Science Tools#
Image('img/tool_box.jpg' , width=500)

Nowadays, a large spectrum of tools is being currently used to extract insights and learn pattern from data in order to make more sensed decision.
We can enumerate a few:
The Microsoft Office Suite (Excel),
SAS,
Stata,
Tableau, etc.
The World of Open Source#
But at the core of Data Science, lie open source Softwares and vibrant communities of users. The Open source arena provides rooms for the new contributors to build upon the work done by those who came before them. Those actual contributors often wear the costume of analysts, engineers, statisticians, and computer scientists. They leverage the use of softwares/programming languages like Java, C, Python, R, Scala to tackle today’s most challenging problems. Out of this bunch, The two most popular programming tools used for data science work are Python and R.
from IPython.display import Image
Image('img/anaconda.png' , width=300)

What is Anaconda?#
Anaconda is a complete, open source data science package with a community of over 6 million users. What positively strikes about it is its easiness to download and install, and its supported on Linux, MacOS, and Windows. Though this part of the course will be taught using Python, Anaconda provides a great support for R through diverse libraries and packages. The Anaconda distribution comes ready with more than 1,000 data science packages as well as the Conda package and virtual environment manager, which clears the pain of installing each library independently.
As the Anaconda’s website says, “The Python and R conda packages in the Anaconda Repository are curated and compiled in our secure environment so you get optimized binaries that ‘just work’ on your system.” Apeasing the frustration of newbie users to get started through its desktop graphical user interface (GUI), its homepage provide links to all the applications included with the distribution including RStudio, iPython, JupyterLab, Spyder, Glue, Orange and Jupyter Notebook. The latter will be the focus of the next section.
Task: #
Which Operating system are you running?
Try and Open
Anacondaand make sure the dashboard is visible.
The toolbox#
Nowadays, a large spectrum of tools is being currently used to extract insights and learn pattern from data in order to make more sensed decision.
We can enumerate a few:
The Microsoft Office Suite (Excel),
SAS,
Stata,
Tableau, etc.
But at the core of Data Science, lie open source Softwares and vibrant communities of users.
The Open source arena provides rooms for the new contributors to build upon the work done by those who came before them. Those actual contributors often wear the costume of analysts, engineers, statisticians, and computer scientists.
They leverage the use of softwares/programming languages like Java, C, Python, R, Scala to tackle today’s most challenging problems.
Out of this bunch, The two most popular programming tools used for data science work are Python and R
R vs Python#
Image('img/RvsPy.jpeg')
The world of data scientists has made a tremendous use of those two to the extent where it is difficult one over the other when it comes to perform analytics on your data.
The richness of those two giants comes from the fact there are free and open source.
Though R is widely considered as a tool for statistical analysis, Python pauses more as a general-purpose programming language.
For anyone practicionner (beginner or advanced) in machine learning, working with large datasets, or creating complex data visualizations, those languages come essentially handy. Let’s walk ourselves through a brief introduction of both.
Python#
Released in 1989, Python is an object-oriented programming language whose philosophy has a particular emphasis on code readability and efficiency.
Simply put, Python works by grouping data and code into objects that can interact with and modify one another. Data scientists find it fairly easy deal with since it helps them execute tasks with better stability, modularity, and code readability.
To see the bigger picture, the Python ecosystem is quite diverse and goes far beyond serving the Data Science community. Web Developers, Software engineers, could also find their way through it.
Recently, The Python community has empowered the Machine Learning and Deep Learning ecosystem with its state-of-the-art suite of libraries including scikit-learn, Keras, and TensorFlow, which enable data scientists to develop sophisticated Machine Learning and Deep Learning models that plug directly into a production system
Image('img/python.jpg' , width=200)

R#
Developed in 1992 with the purpose of serving Academia, it has been the bread and butter of most data scientists/statisticians for years. Pictured as a procedural language built upon the philosophy of statistical learning, it works by breaking down a programming task into a series of steps, procedures, and subroutines. When it comes to building data models, it can be of a great advantage because it makes complex operations relatively easy to understand, though this is often at the expense of performance and code readability.
The community behind it being more analysis-oriented, they have developed open-source packages for specific complex models that would spare a data scientist the pain of building those from scratch. Another great thing about R is it emphasis on quality reporting backed with clean visualizations and frameworks for creating interactive web applications. As stated above, it slower performance and a lack of key features like unit testing and web frameworks are the reasons that some data scientists prefer to look elsewhere.
Image('img/R.png', width=200)

Depending on the tasks one is presented with, the goal to achieve as well the priority, a couple of questions need to be answered before making a trade-off:
Is the user has enough experience in programming language?
Is the bottom line of the work going to serve the industry or the academia?
Does visualisation play a key role in the process of the work?
Does the work entail Machine Learning or Stastistical Learning?
Does the work mix data analytic with any complex analysis pipelines?
Though it is recommended to learn both to widen your knowledge and enrich your data science toolbox, answering those questions could be helpful to deciding which one to go for.
Image('img/exit.jpg', width=200)